1 The working principle of differential scanning calorimetry (DSC)

Differential Scanning Calorimetry (DSC) is a thermal analysis method developed after the 1860s. It is a method of measuring the relationship between the power difference input to the sample and the reference material and the temperature under the control of the program temperature. Kind of technology [1,2]. The accuracy of this change in measurement difference is higher than the measurement of the absolute value of heat flow or power [3]. Its main features are a wide temperature range (-175~725 ℃), high resolution and high sensitivity. Because the instrument can quantitatively determine various thermodynamic parameters (such as enthalpy, entropy and specific heat, etc.) and kinetic parameters, it has been widely used in applied science and theoretical research. According to the different measurement methods, it is divided into two types: power compensation type DSC and heat flow type DSC. The biggest difference between the two is the different structure design principle. Under general experimental conditions, the power compensation type DSC is selected. The instrument has two relatively independent measuring cells, and its heating furnace is equipped with a test sample and a reference substance. These two heating furnaces have the same heat capacity and thermal conductivity parameters, and scan according to the same temperature program. The reference material does not have any thermal effect in the selected scanning temperature range. Therefore, the thermal effect recorded during the test is caused by the change of the sample. When the sample undergoes exothermic or endothermic changes, the system will automatically adjust the heating power of the two heating furnaces to compensate for the heat change of the sample, so that the temperature of the sample and the reference are always the same. This is the power compensation DSC instrument. Working principle.
In the specific experiment process, the sample is heated at the set heating rate. At the beginning of heating, the sample and the reference are heated at the same temperature, the sample has no heating effect, and the DSC curve is a flat baseline. When the temperature rises to the glass transition temperature of the sample, the chain segment of the macromolecule starts to move. The heat capacity of the sample changes significantly. As the heat capacity increases, more heat needs to be absorbed, so a turning point appears on the DSC curve. The temperature corresponding to this turning point is the glass transition temperature (Tg). If the sample is crystallizable and in a supercooled amorphous state, it will start to crystallize in a certain temperature range above the glass transition temperature and emit a large amount of heat at the same time. At this time, the DSC curve appears as an exothermic peak; further heating , The crystal begins to melt and needs to absorb heat, and its DSC curve has an endothermic peak in the opposite direction of the exothermic peak. The temperature corresponding to the apex of the melting peak is recorded as the melting point (Tm); other changes may occur when the sample continues to be heated, such as oxidation and decomposition (oxidation is an exothermic reaction, decomposition is an endothermic reaction, see Figure 1). Therefore, the glass transition and characteristic temperature of the polymer can be determined according to the DSC curve.
Figure 1 Schematic diagram of DTA and DSC curves of polymer
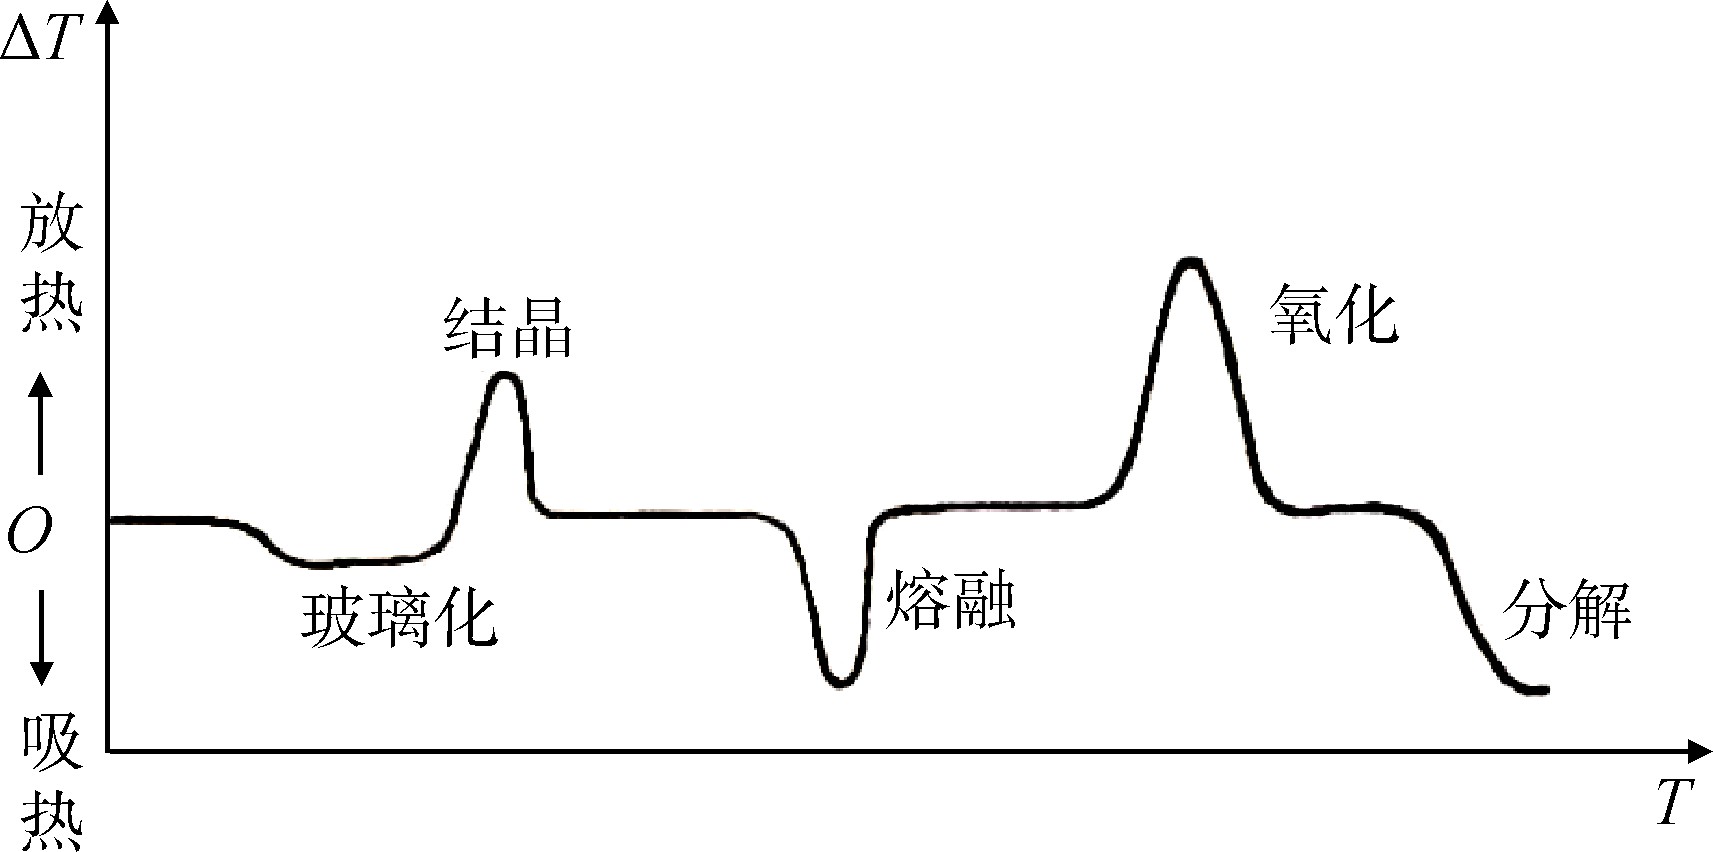
Fig.1 Diagram of DTA and DSC curves of polymers
2 Factors affecting the results of DSC experiments
2.1 Heating rate
It is generally believed that the main thermodynamic parameter for quantitative determination of DSC is enthalpy, which is little affected by the heating rate, but the actual test results show that the heating rate is too high will cause uneven temperature distribution inside the sample, and the furnace body and the sample will also generate heat. The state of equilibrium, so the influence of the heating rate is very complicated. Generally, it mainly affects the peak value, peak shape and narrow width of DSC [4]. If the heating is too fast, the baseline drift is obvious, the peak resolution is poor, and the peak top temperature will shift to the high temperature direction; the heating rate is slow, and the peak is sharp, so the resolution is also good. The heating rate has a great influence on the determination of Tg, because the glass transition is a relaxation phenomenon of the amorphous part of the polymer from the frozen state to the thawed state from the molecular structure[5,6], the heating rate is too slow, the transition Not obvious, or even observable; the temperature rises quickly and the transition is obvious, but the Tg moves to high temperature. The heating rate has little effect on Tm, but some polymers will undergo reorganization and crystal perfection during the heating process, so that both Tm and crystallinity are improved.
2.2 Reference substance
To obtain a stable baseline, thermally inert materials similar to the heat capacity, thermal conductivity, particle size and other properties of the sample should be selected as the reference material as much as possible. Commonly used reference materials are alumina, calcined MgO and SiO2.
2.3 Atmosphere and pressure
Different gases have different thermal conductivity, which will affect the thermal resistance between the furnace wall and the sample, and affect the peak temperature and enthalpy value. Some samples or their thermal decomposition products may react with the surrounding gas, so the appropriate atmosphere should be selected according to the needs. On the other hand, for the reaction of releasing or absorbing gas, the temperature and shape of the peak will also be affected by the gas pressure. The atmosphere can be static or dynamic. As far as the nature of the gas is concerned, it can be inert or participating in the reaction, depending on the experimental requirements. For the determination of the glass transition and phase transition of polymers, the atmosphere has little effect, but nitrogen is generally used and the flow rate is about 30 mL/min.
2.4 Sample amount
The sample size is small, the peak is small and sharp, and the peak resolution is good [7]; the sample size is large, the peak is large and wide, and the peak position moves to the high temperature direction. When the sensitivity of the instrument permits, the sample should be as small as possible, not too much, so as not to make the internal heat transfer slow, the temperature gradient is large, and the peak shape expands and the resolution decreases. Someone has studied the influence of the sample dosage of high-density polyethylene (HDPE) on DSC [8], and the experimental results are shown in Figure 2.
2.5 Sample size
When the powder particle size is different, due to the influence of heat transfer and diffusion, there will be differences in the test results. Generally, the finer the particle size, the lower the peak temperature and the smaller the peak width. But the corresponding thermal reaction is unchanged, but the reaction speed changes. When the particle size is too fine, the shape of the curve will also be affected due to rapid water loss. Figure 3 shows the impact of HDPE sample size on DSC [8].
Figure 2 The influence of sample quality on DSC test
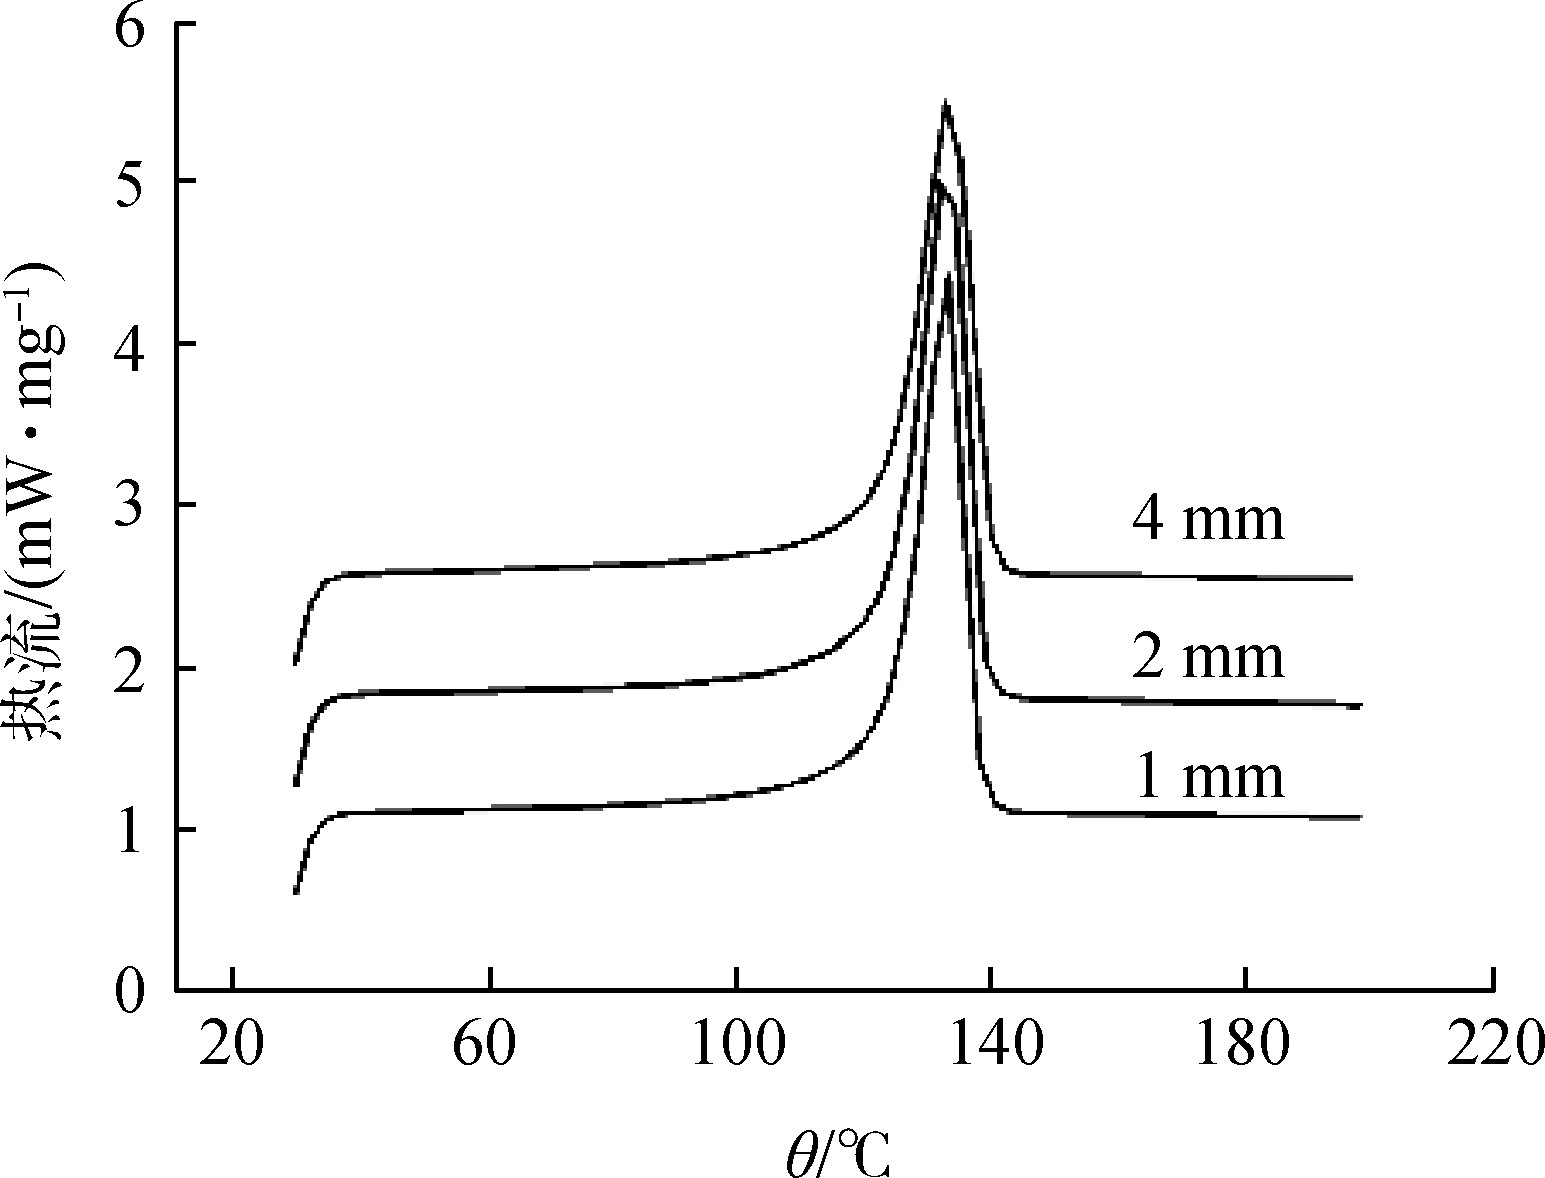
Fig.2 Effect of sample quality on DSC testing
Figure 3 The influence of the particle size of the sample on the DSC test
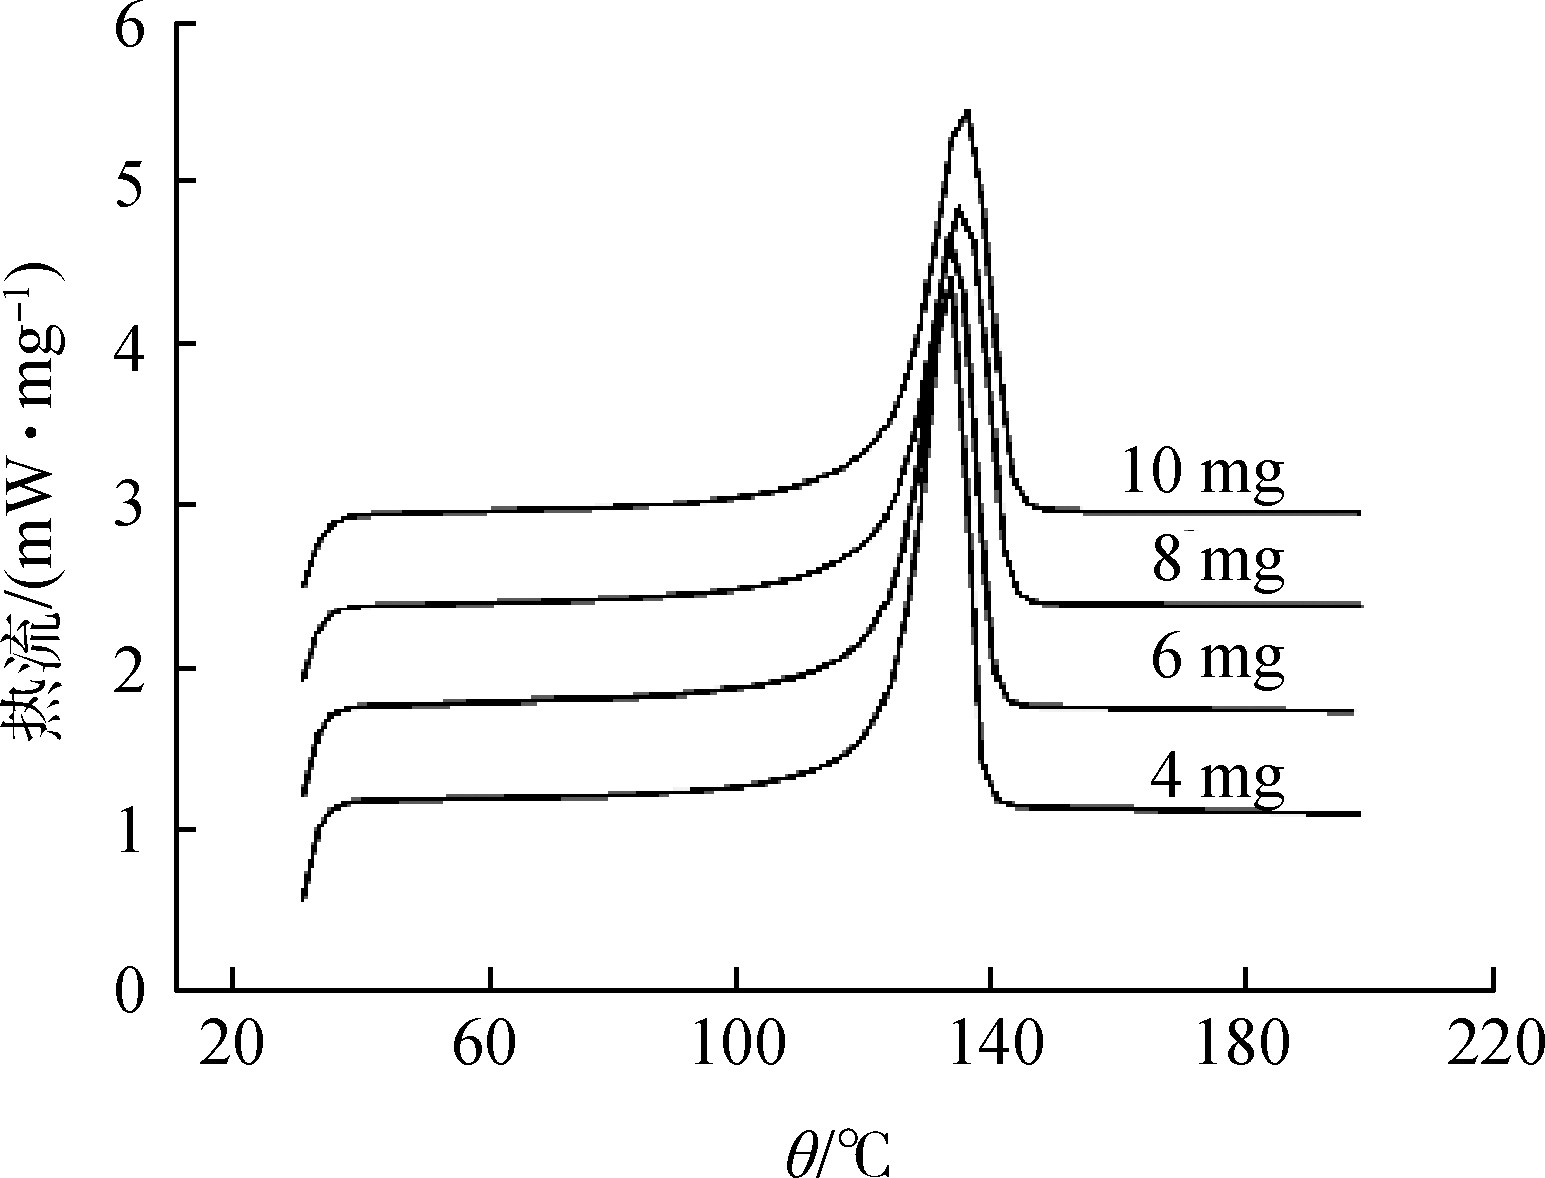
Fig.3 Effect of sample size on DSC testing
3 Application of DSC in polymers
The characterization of polymer materials mainly includes the following four aspects: morphological characterization, mainly using SEM, TEM, AFM, etc.; thermal properties, mainly using DSC, TG, etc.; rheological properties; mechanical properties. Among them, thermal performance is an important aspect in the research of polymer materials. The DSC test curve can clearly show the inevitable connection between the mechanical properties in the principle of polymer thermodynamics and its thermodynamic properties—glass transition temperature (Tg), melting temperature (Tm), crystallization temperature (Tc), and enthalpy value. The oxidation induction period test can directly obtain information about the interaction between the oxidation behavior of polymer materials and additives. High-pressure DSC can further analyze the changes in the oxidation reaction, cross-linking reaction and crystallization behavior of polymer materials under different pressure test conditions. The shape of the melting peak on the DSC curve can reflect the distribution of the crystal grain size of polymer crystals, and the enthalpy of melting directly gives the crystallinity of the material [9]. In the process of using DSC analysis to detect semi-crystalline thermoplastic materials, most of the materials will have an exothermic cold crystallization peak before their melting temperature. This phenomenon reflects the shrinkage of semi-crystalline thermoplastic materials and provides a powerful help for the selection of materials in the actual production process. For example, in a traditional DSC measurement, an amorphous polyethylene terephthalate (PET) sample undergoes a glass transition at a heating rate of 10 ℃/min, and then the original frozen segment is After thawing, the recombination took place cold crystallization; finally as the temperature increased, this cold crystallization was broken again and melted [3]. However, in the ultra-fast DSC measurement, at a heating rate of 60 000 ℃/min, the amorphous PET molecules have no time to reorganize and crystallize, and only the glass transition is observed on the heat flow curve (see Figure 4). DSC analysis technology can also measure the impact of impurities and humidity on polymer materials. At the same time, the cooling process can also reflect the mutual influence between the material’s crystallization temperature, crystallization rate, nucleating agent and material processing methods. The secondary heating curve directly illustrates the direct influence of processing technology and preparation conditions on the material. Specific applications in polymer materials include: determination of the glass transition temperature of polymer blends, based on which to judge the compatibility of the blend system, the study of polymer thermal stability, the effect of nucleating agents on crystallinity, Research on thermal aging properties of polymers, etc.
Figure 4 The heating DSC curves of traditional DSC and ultra-fast DSC for amorphous PET samples
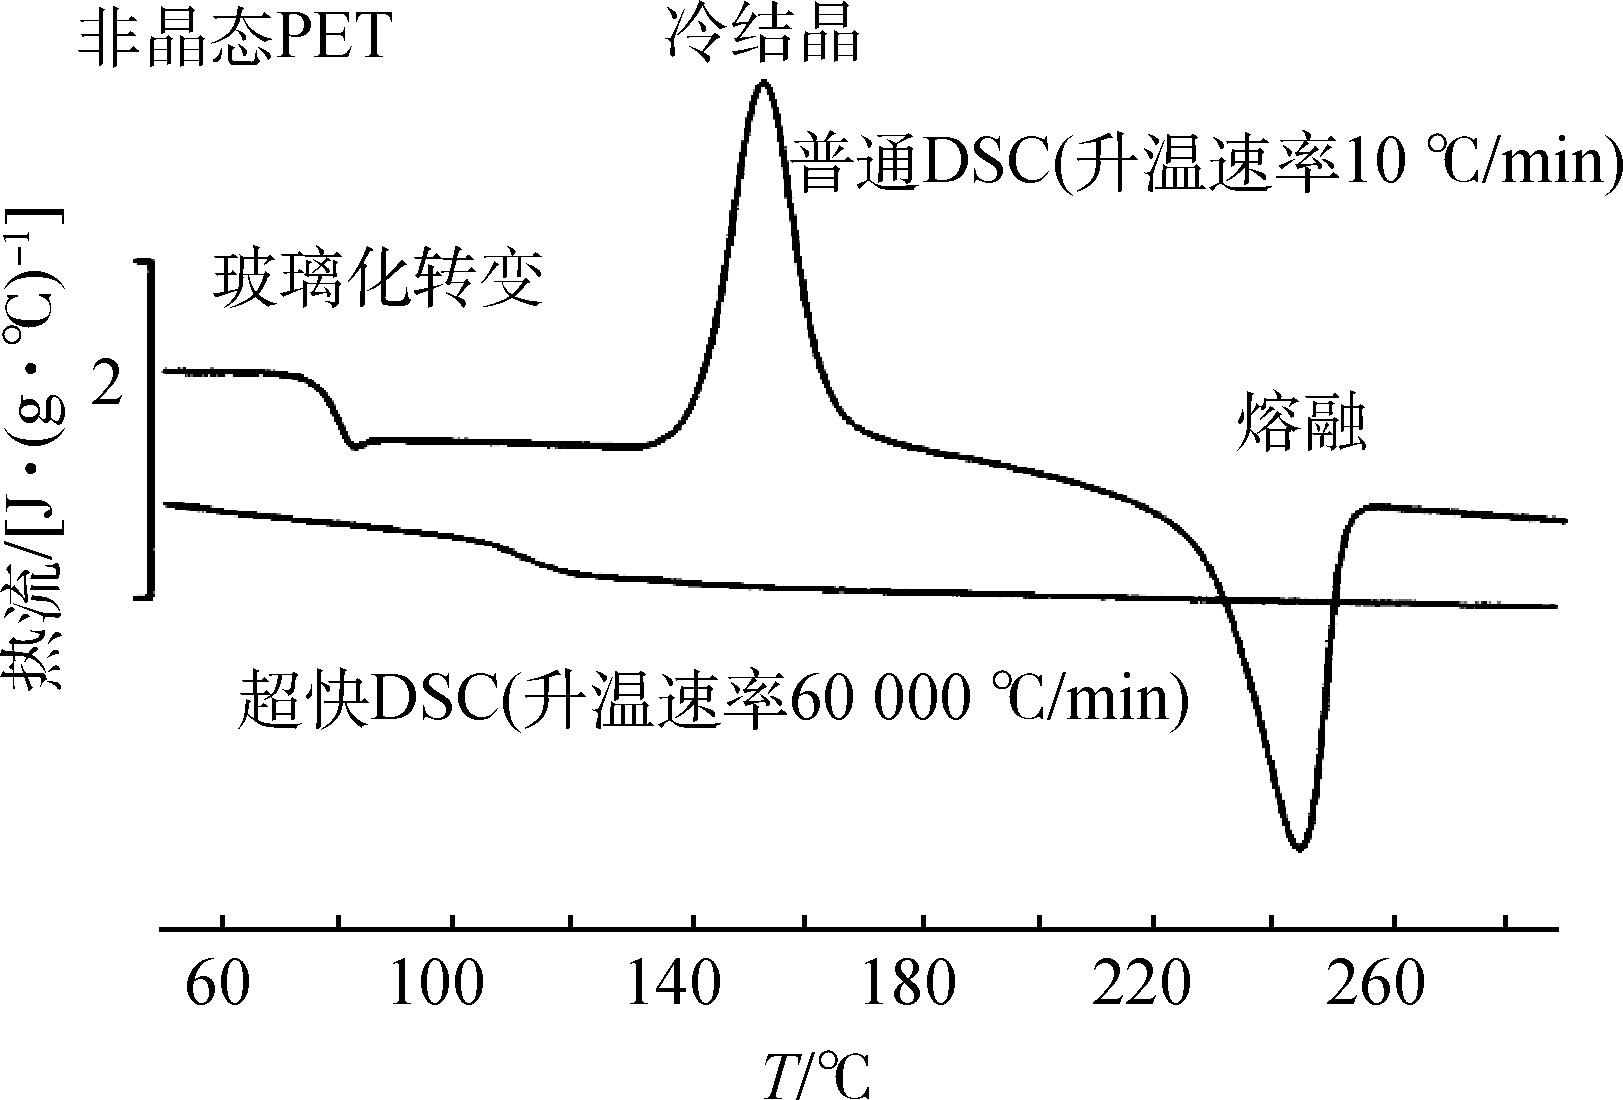
Fig.4 Temperature-rising DSC curves of conventional DSC and ultra-fast DSC for amorphous PET samples
4 Experience in experimental teaching
In order to expand students’ knowledge, many colleges and universities have opened courses such as Introduction to Polymers, and added some experimental contents of polymer. In order to enable these non-polymer majors to better grasp the working principles of DSC and deepen their understanding of the results of DSC experiments, it is necessary for students to clearly understand the following questions in the experimental explanation.
4.1 The difference between DSC and DTA and their respective scope of application
Differential thermal analysis (DTA) is a thermal analysis method that measures the temperature difference between the sample and the reference and the temperature relationship under the condition of program control temperature. The change of the heat conduction of the sample during the transformation is generally unknown, so the ratio of the temperature difference to the heat change is also unknown, which makes the quantitative calculation of the heat change performance unsatisfactory. Another technique based on DTA by adding a compensation heater is differential scanning calorimetry. DSC directly reflects the heat change of the sample during the transformation, which is convenient for quantitative determination. Since the endothermic and exothermic directions of the DTA/DSC curves of various instruments are different, the endothermic or exothermic direction must be indicated on the curve. The transformation and thermal effects measured by the two methods are similar. The difference is that DTA is generally used to qualitatively determine the transition temperature (peak position), because the temperature difference is related to the tightness of the sample stacking, heat transfer rate and specific heat capacity, etc., the accuracy of quantitative processing by the peak area is poor, but DTA can be measured To above 1 500 ℃; DSC is suitable for quantitative analysis, because the peak area directly corresponds to the magnitude of the thermal effect, but the maximum temperature can only reach about 700 ℃. In general, DSC has better resolution, repeatability, accuracy and baseline stability than DTA, and is more suitable for the study of organic and polymer materials; while DTA is more used for the analysis of inorganic materials such as minerals and metals.
Using the DTA method to analyze the above-mentioned reactions does not reflect whether the weight of the substance has changed, nor can it indicate whether it is a physical change or a chemical change. Methods (such as spectroscopy, mass spectrometry, etc.).
4.2 The characteristics of polymer melting
The melting of small molecules and polymers is a thermodynamic first-order phase transition process. During the melting of small molecules, the thermodynamic function of the system changes with temperature in a very narrow range, only about 0.2 ℃, while the polymer presents a wide melting temperature range. That is, there is a “melting limit”. The reason for the melting limit when crystalline polymers melt is mainly due to the different crystal morphology and degree of perfection of the polymers. During the crystallization process, as the temperature decreases, the melt viscosity increases rapidly, and the mobility of the molecular chain decreases. It is too late to make sufficient position adjustments when laying the crystal lattice, so that the formed crystals stay at different stages; in the melting process In the medium, the smaller and more imperfect crystals will melt at a lower temperature, and the larger and more complete crystals need to be melted at a higher temperature, so there is a “melting limit”; the smaller the size, The less perfect crystals are melted and further crystallized into more perfect crystals at a higher temperature, that is, the so-called secondary crystallization, and then can be melted at a higher temperature. After fully understanding the crystallization and melting process of polymers, some researchers designed such an experiment. During the test, the temperature was increased by one degree, and the temperature was kept constant for 24 hours. In such a long experimental process, the “melting limit” was finally reached. Becomes very narrow. The reason is that the crystals with imperfect crystallization are produced through secondary crystallization to produce more perfect crystals, and then all melt in a smaller temperature range.
4.3 Problems that need attention in the vitrification test of polymer materials
Vitrification is a step transition of the molecular mobility of the sample (amorphous component) [3]. The material is hard below the glass transition temperature and rubbery above the glass transition temperature. The change in heat capacity at the glass transition temperature can be used to measure the orderly content of the amorphous components in the sample. When the material is annealed or stored for a long time at a temperature slightly below the glass transition temperature, as the sample transitions to an equilibrium state, this orderliness will develop. Vitrification is actually always a temperature range rather than a definite temperature point. The molecular motion related to glass transition is temperature-dependent and frequency-dependent, so the glass transition temperature increases as the heating rate (DSC or Dynamic mechanical analyzer, DMA) or the test frequency (DMA) increases. Therefore, when reporting the glass transition temperature, it is necessary to explain the test method (using DSC or DMA), the test conditions (the heating rate used, the sample size, etc.), and how the glass transition temperature is determined (1/2 used) The midpoint of the heat capacity, or the inflection point, or the peak value after derivation, etc.). Vitrification has many influencing factors, such as heating rate, heating or cooling process, aging, molecular weight, molecular weight distribution, plasticizers, fillers, crystalline components, copolymers, polymer main chains, side chains, hydrogen bonds, etc. All factors that affect the mobility of molecular chains affect vitrification.
5 Conclusion and suggestions
Differential scanning calorimetry has the advantages of small sample amount, simple sample preparation, fast operation, no solvent, high accuracy of detection results, and good reproducibility. The above is just a brief introduction to some applications of differential scanning calorimetry in polymer research. DSC can also be used to determine and characterize some physical parameters, study polymerization reactions, thermal decomposition of polymers, and adsorption and evaporation of low-molecular substances. , Interaction with solvents, etc.
In terms of instrument technology, Modulated Differential Scanning Calorimetry (MDSC) is currently developing relatively rapidly. Traditional DSC can only give the heat flow signal of the total heat absorption or heat release, but cannot distinguish the overlapped heat flow signals. Thermal phenomenon. MDSC superimposes the sinusoidal temperature control program on the traditional DSC heating program. It can not only obtain the total heat flow signal but also separate the reversible part and the irreversible part from the total heat flow signal through Fourier transform, which can be seen more intuitively. Information such as the heat capacity of the object to be tested can provide a more comprehensive understanding of the properties of the material [10]. At present, there are various types of combined calorimeters, such as infrared spectroscopy-gas chromatography-differential scanning
Any further question please contact us https://www.upwelltest.com or Email :info@upwelltest.com